Welcome to our biomedical imaging blog!
We plan to use this platform to explore topics in biomedical imaging, ranging from light and optics to microscopy and medical imaging. We will draw from current events, our personal backgrounds and interests, and reader suggestions. We also may have occasional guest posts.
We would like to begin by exploring the relationship between two topics near and dear to us: imaging and illustrating.
Merriam defines “imaging” as “the action or process of using specialized techniques … to produce an image of something that is not visible to the naked eye.” This can include things too small to be otherwise seen, such as cellular structures, and/or things too obscured to be otherwise seen, such as internal bodily organs. Small things are typically imaged using microscopy, while obscured things are typically imaged using medical imaging. Imaging is the subject-matter heart of this website and our Introductory Biomedical Imaging textbook.
Merriam defines “illustrating” as “to provide with visual features intended to explain or decorate” and “to make clear by giving or by serving as an example or instance.” Illustrating is the pedagogical soul of the website and textbook.
It turns out that neither biomedical images nor biomedical illustrations are exact replicas. Instead, both are renditions intended to illuminate, or shine a light on, a structure or a process or a situation. Both require a vision and a set of skills to produce. However, how images and illustrations are chosen, and how they are presented, is subject to significant discretion.
The production of medical images is a multi-step process. First, a radiologist chooses a technique—ultrasound, x-ray imaging, radionuclide imaging, or magnetic resonance imaging (MRI)—best suited to visualizing the bodily structure or process of interest. Then, a radiologic technologist makes further choices about how to generate and display the images. The technologist’s choices can determine how the image data are acquired. For example, in an MRI brain scan, the technologist can choose pulse sequences and pulse durations that determine whether CSF (cerebrospinal fluid) is bright and white matter is dark (T2 weighting), or CSF is dark and white matter is bright (T1 weighting), among other possibilities.
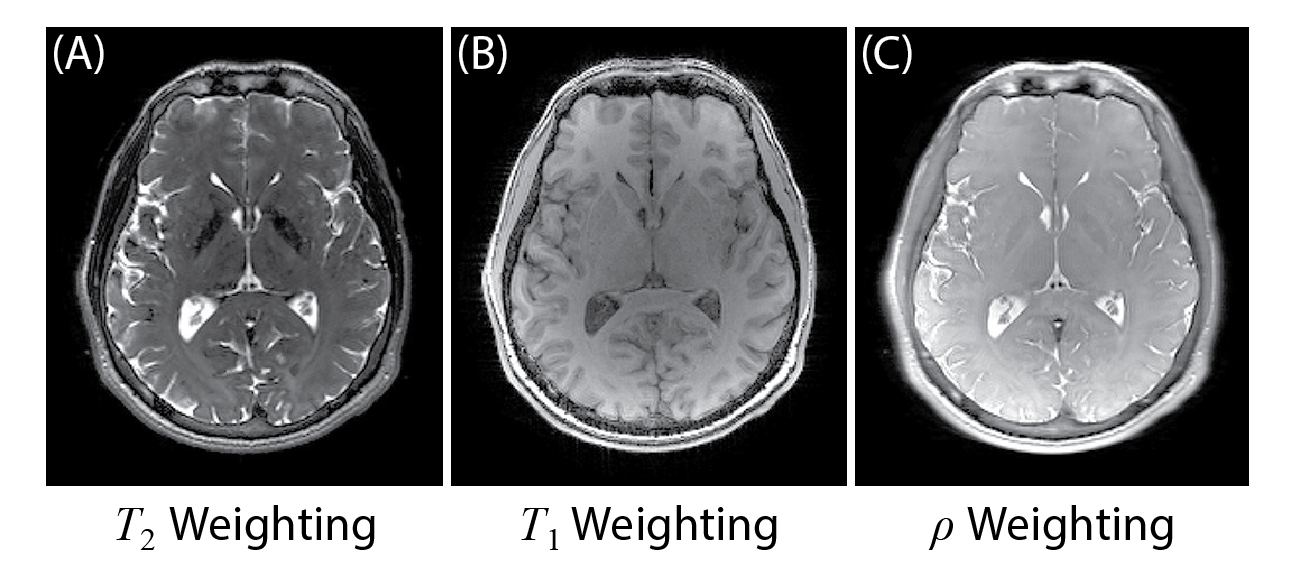
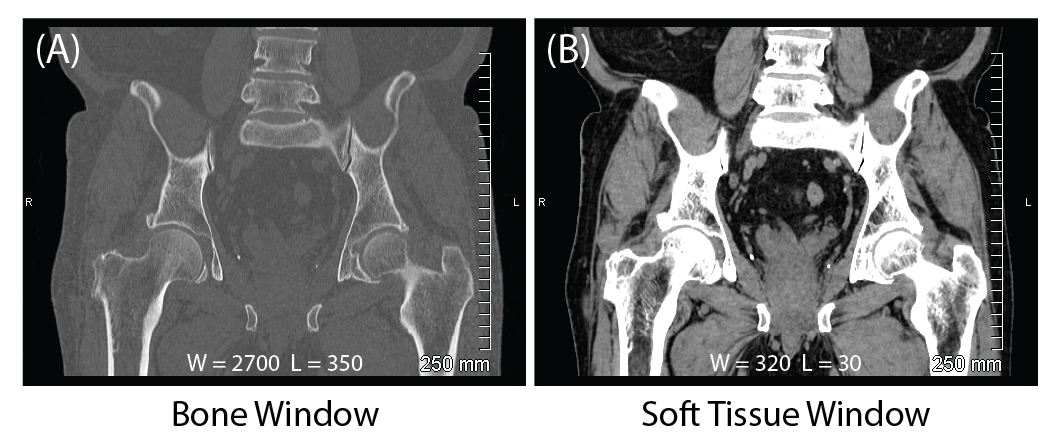
The technologist can also choose how the images are displayed after the image data have been collected. For example, in x-ray-based computed tomography (CT), the technologist can vary the grayscale “window” to determine whether soft tissue or bone is emphasized.
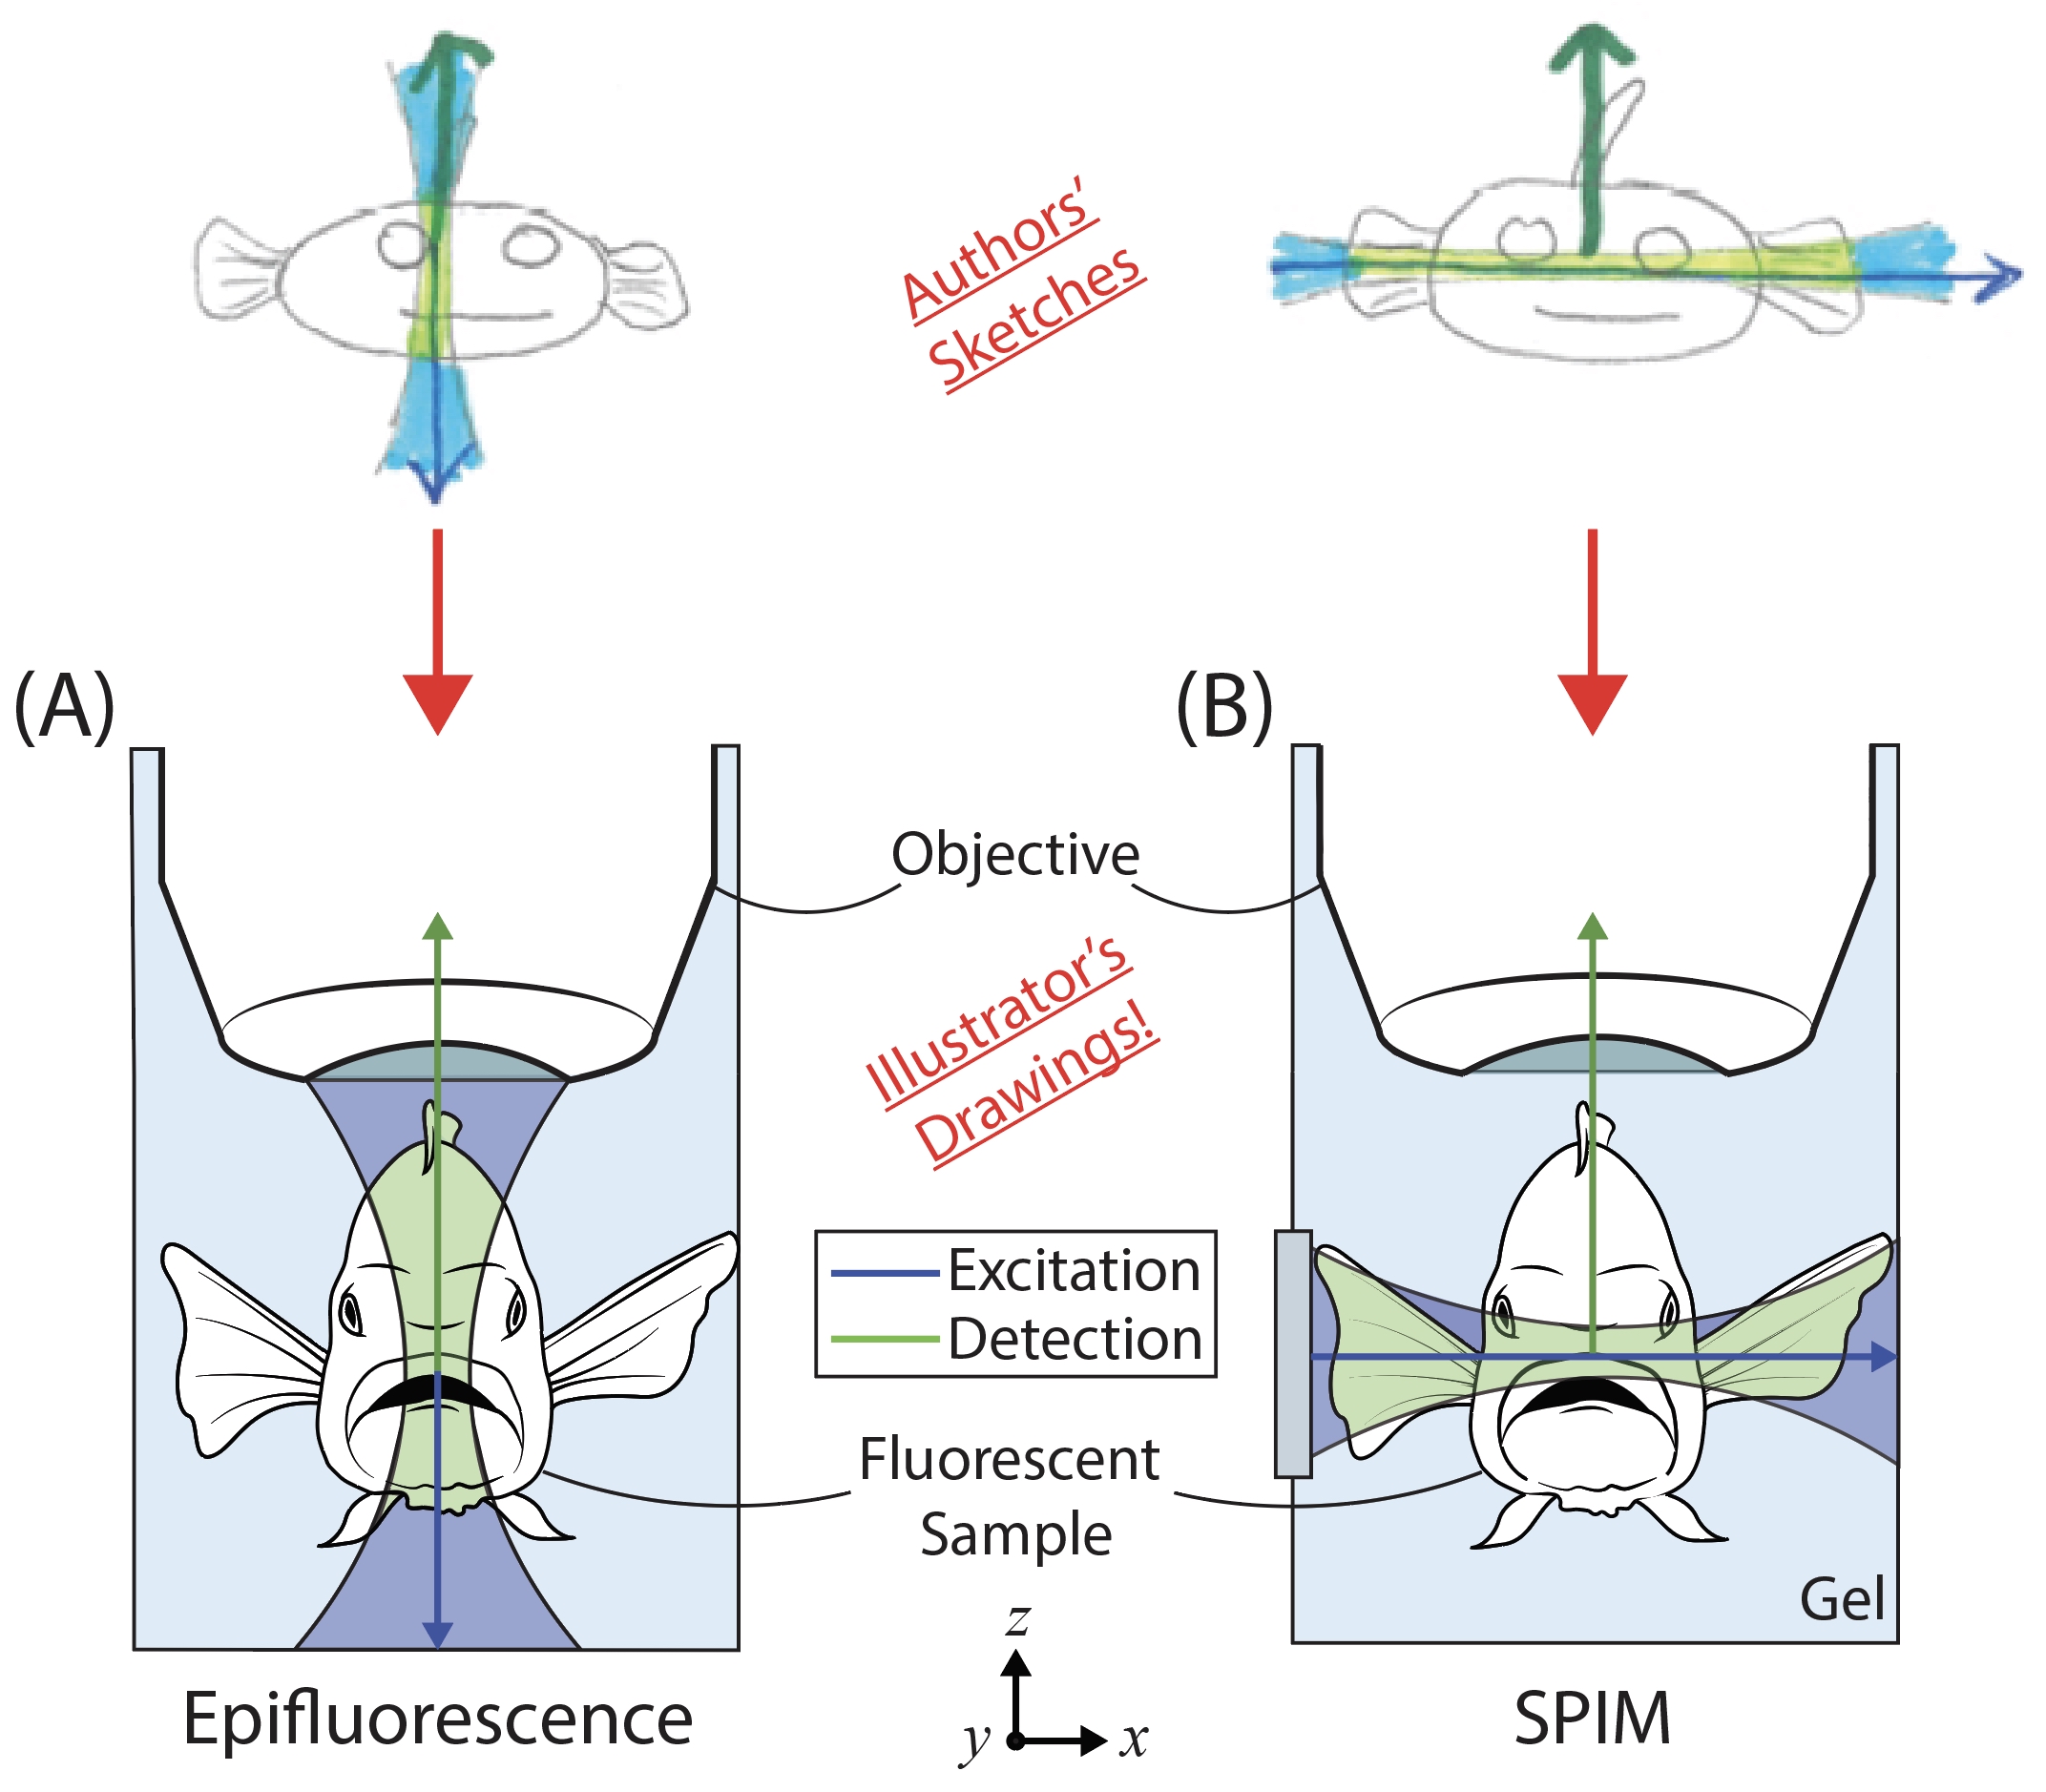
The production of illustrations is similarly a multi-step process, involving choices of design, platform, and execution. We use illustrations on this website, and in Introductory Biomedical Imaging, to assist with and complement our written explanations of imaging techniques and the underlying physics. We typically design these illustrations with pencil and paper, or using Microsoft Excel in the case of graphs, and then draw them using Adobe Illustrator. We try to keep illustrations simple, attractive, and on point. For example, whenever possible, light in our illustrations always travels from left to right, or from top to bottom. Moreover, whenever possible, we used the same colors and schematics for the same or analogous features. We have also tried to give our illustrations a slightly playful look. Toward that end, we were incredibly lucky when writing the textbook to have worked with a Lewis & Clark College art student, Cyan Cowap, on drawings that benefited from an artist’s touch.
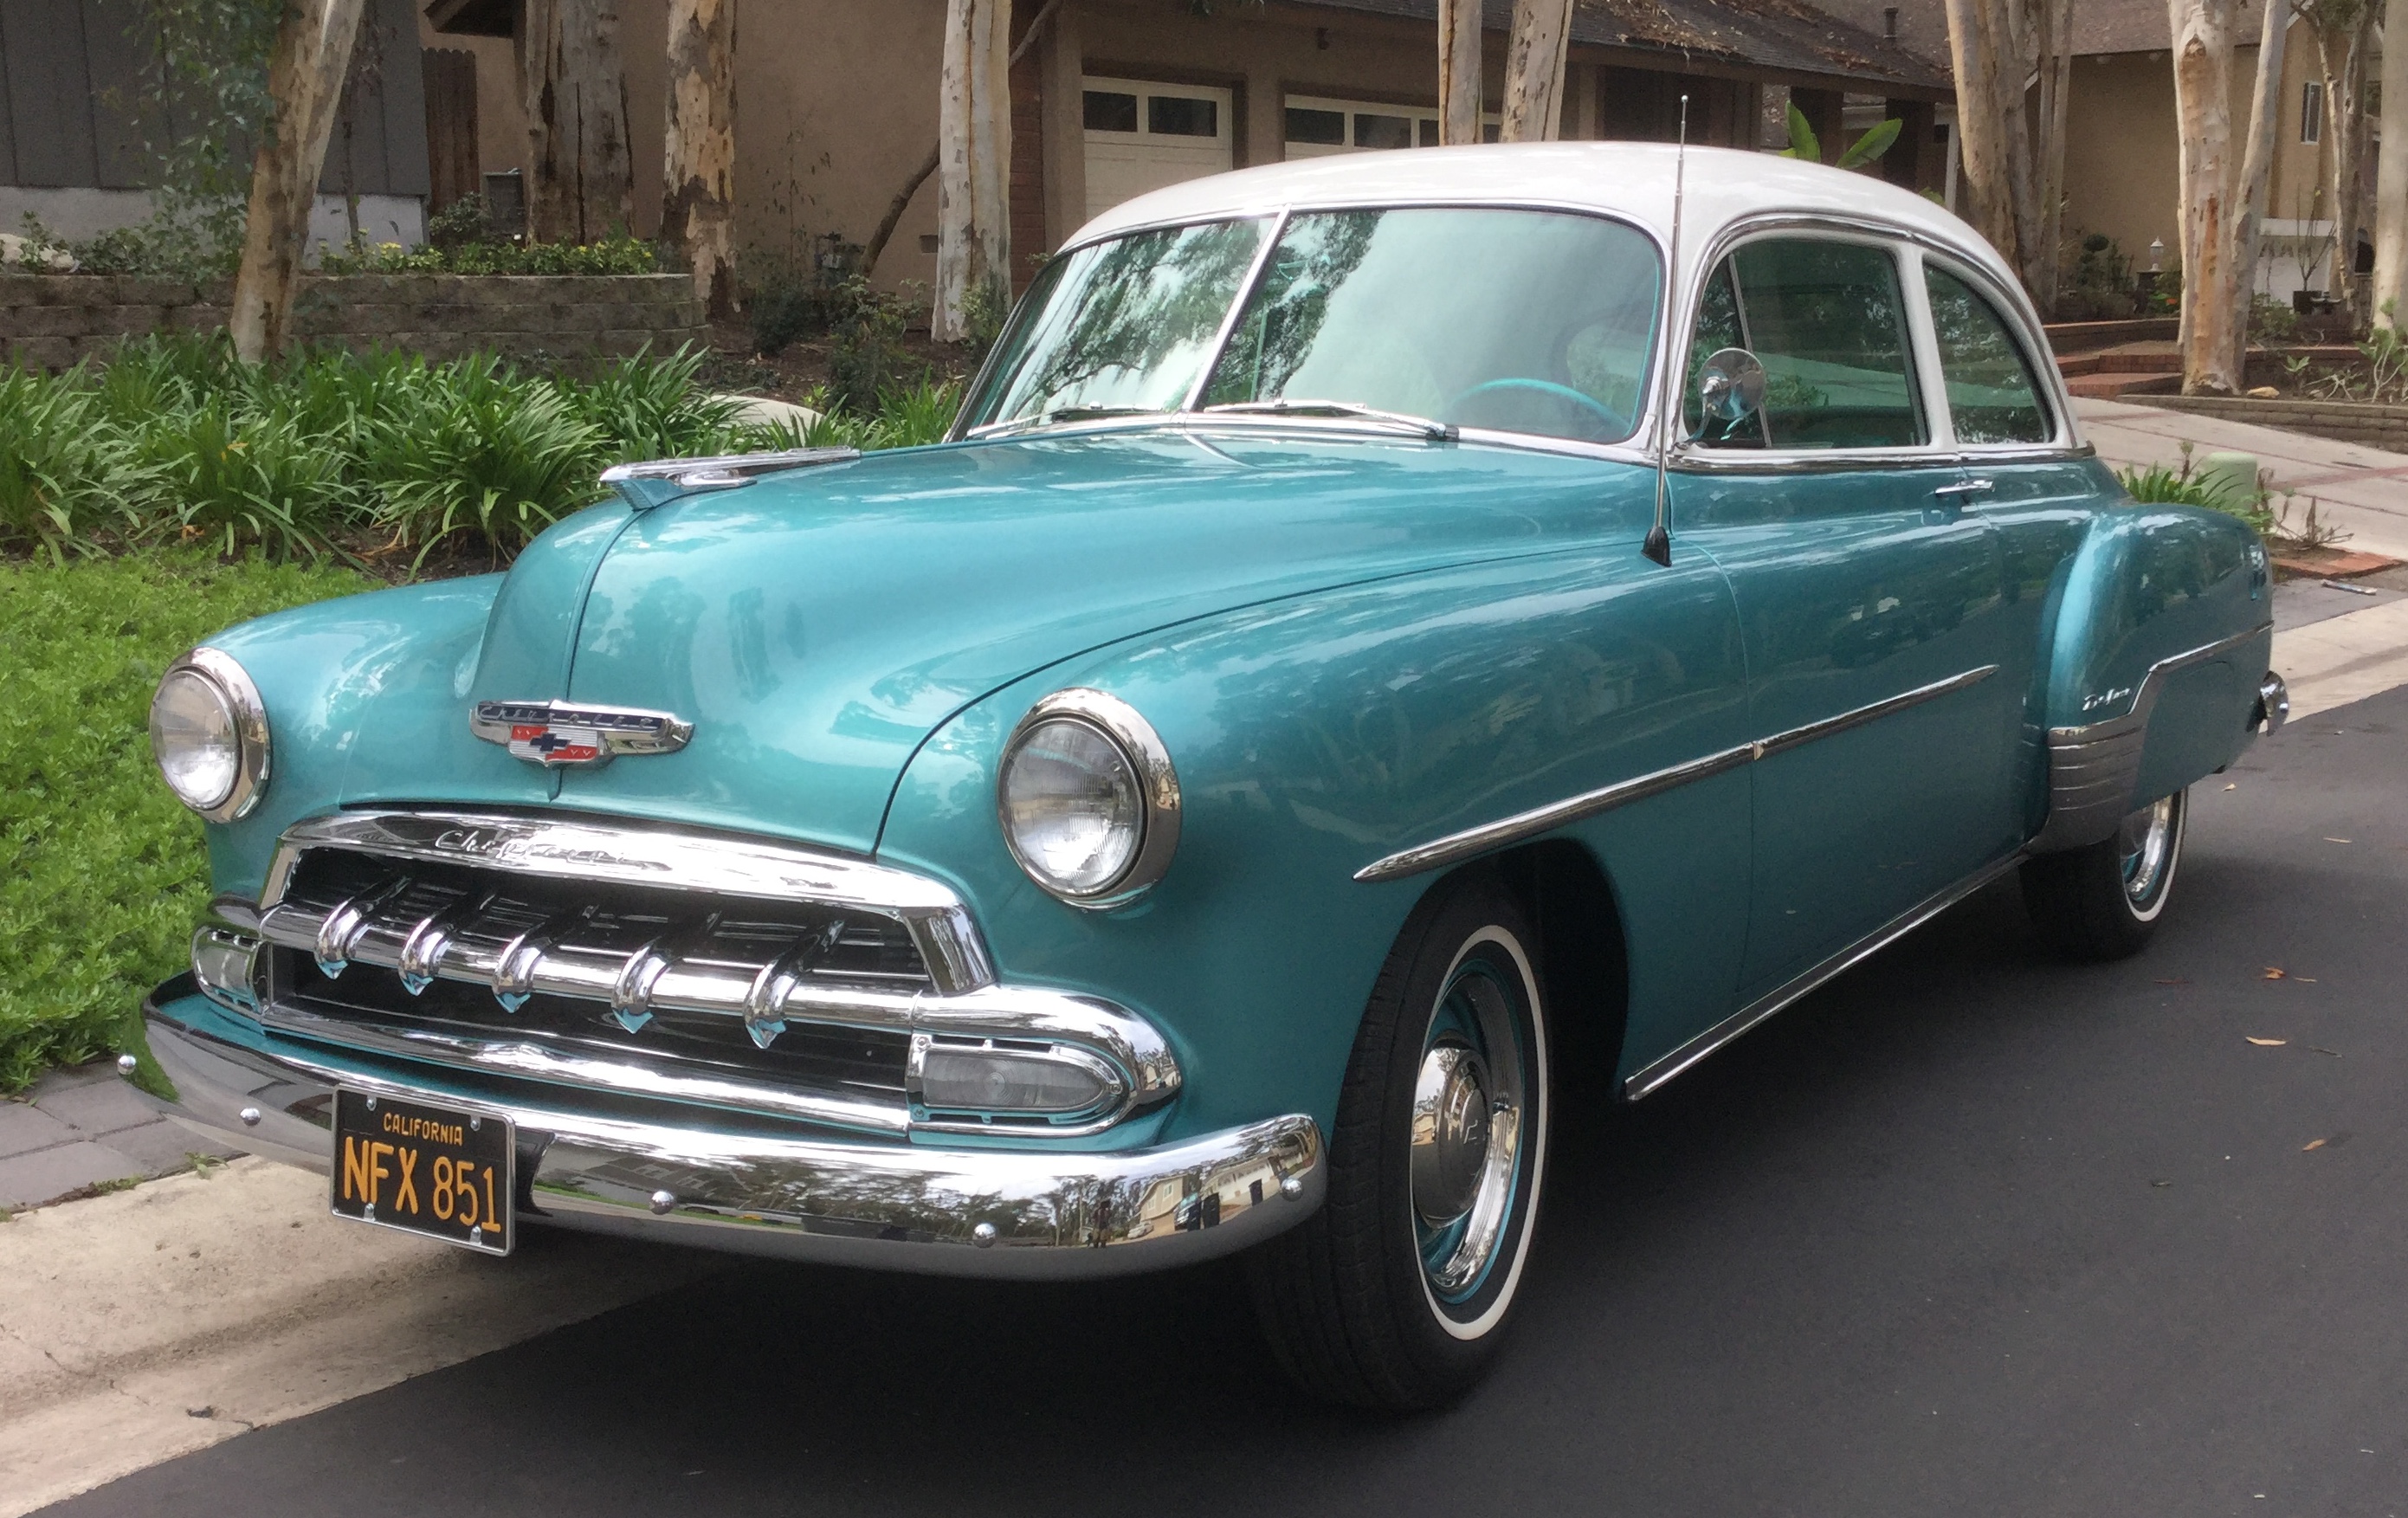
Finally, for continuity, we always use a common color palette, typically involving shades of blue. We even painted our car that shade.
We hope that you will learn from and enjoy the products of our efforts and will be back soon with some more substantive posts.